PDK can be used to create a barebones module which sets up the correct directory structure, and templates some unit tests for you.
You get the commands pdk validate
to perform basic parsing of all the relevant files, and pdk test unit
to run your unit tests.
Puppet have some excellent documentation available here that includes how to install PDK, how to create a module using it and how to test, so I won’t go over that.
However, documentation on using Litmus for acceptance testing, and in particular using it on Windows where you don’t have docker to hand isn’t as forthcoming so this is my attempt to fill in a few of the blanks that I had.
njhowell/puppet-pdk-example contains an example puppet module created using PDK. I’ve created a default class that just creates a temp file for the purposes of this.
Running pdk validate
will parse the various files in the module, and pdk test unit
will run the unit tests. The automatically generated unit test simply checks that the module compiles.
PDK includes puppet_litmus
in the Rakefile
that it generates, but there’s still a bit more config to do to get started.
Full details are on the Litmus wiki but if you’ve started with PDK, then you need to do the following:
.fixtures.yml
file
---
fixtures:
repositories:
facts: 'https://github.com/puppetlabs/puppetlabs-facts.git'
puppet_agent: 'https://github.com/puppetlabs/puppetlabs-puppet_agent.git'
provision: 'https://github.com/puppetlabs/provision.git'
spec/spec_helper_acceptance.rb
# frozen_string_literal: true
require 'puppet_litmus'
require 'spec_helper_acceptance_local' if File.file?(File.join(File.dirname(__FILE__), 'spec_helper_acceptance_local.rb'))
include PuppetLitmus
PuppetLitmus.configure!
Next up, I created provision.yaml
in the root of my module to create a provision list for litmus to use. This effectively lets you define lists of VMs to start to run your acceptance tests against.
For this example, I create a list called ‘vagrant’ and have it create a Ubuntu 18.04, Ubuntu 20.04 and Debian 9 VM using the virtualbox provider.
---
vagrant:
provisioner: vagrant
images: ['generic/ubuntu1804', 'generic/ubuntu2004', 'generic/debian9']
params:
vagrant_provider: virtualbox
You can replace the image names with any image from VagrantCloud. Just make sure the image supports the provider you’re using (virtualbox in this case).
Next, lets see if it works.
Run pdk bundle install
to install the gems listed in your Gemfile
(this should be auto generated, so no need to modify it).
Then, you can start your VMs. Run pdk bundle exec rake litmus:provision_list[vagrant]
. After a short while, you should see it using the vagrant provisioner to create your VMs.
We’re only part way there though. We still need to install the puppet agent, fix up the PATH environment variable (special step needed for vagrant images), install our module, run the acceptance tests, and then we can destroy the VMs. Before we get to any of that though, we should write some acceptance tests.
In the spec
folder, create another subfolder called acceptance
and inside that create a file named for your class. For example, in this case it’ll be example_spec.rb
. A very simple acceptance test might look like this:
require 'spec_helper_acceptance'
pp_basic = <<-PUPPETCODE
class {'example':
}
PUPPETCODE
idempotent_apply(pp_basic)
Use the pp_basic
variable to write some puppet to apply your module in some way. This class is very simple, but a more complex one may include parameter values for example.
This is also a very simple test - all is does is check that the manifest is applied in an idempotent way. You’ll want to add more tests to confirm that it’s actually creating the resources you expect.
With that done, we can put it all together:
pdk bundle exec rake litmus:install_agent
will install the puppet agent on each VM you provisionedpdk bundle exec bolt task run provision::fix_secure_path --modulepath spec/fixtures/modules -i inventory.yaml -t ssh_nodes
This calls a bolt task directly and references the inventory.yaml file that litmus generates in the provision stage.pdk bundle exec rake litmus:install_module
installs the module we’re testingpdk bundle exec rake litmus:acceptance:parallel
runs our acceptance tests.If all went to plan you should see that the tests finished with no failures. At this point you can either tear down the VMs, or make changes to your module, install it again, and run your tests some more.
Tear down the VMs with pdk bundle exec rake litmus:tear_down
.
Litmus offers a nice framework for running acceptance tests, and it seems to be where the Puppet community is moving. Most examples use docker, which is great if you’re developing on Linux, or have docker on windows configured. Unfortunately, I used VMware Workstation and Virtualbox, which prevents me from also having Hyper-V (and thus docker) running on my system.
]]>Packer is a tool from Hashicorp that automates the building of machine images. Natively it supports a huge range of virtualisation options, but for our purpose, we use Virtualbox and VMWare Workstation. Our Virtualbox images are used by developers using Vagrant on their local systems, and our VMWare images are used for both Vagrant and our internal Openstack platform (which we use VMWare vCenter / ESXi for the compute resources).
The Packer Getting Started guide gives a good overview of how to use it. In a nutshell, a Packer configuration consists of an array of builders
and, optionally, an array of provisioners
. Builders
define how to launch a VM on a particular platform, while the provisioners
define what scripts to run on that image to prepare it in the way you want. Once those scripts have been run, Packer will shut down the VM and export it in some way depending on the builder. For example, that may be an AMI for EC2 or a file such as a vmdk for VMWare images. You can have multiple builders
in a single Packer configuration, which means you can effectively build an identical image for multiple platforms very easily.
I’m going to talk about a few of the things we do to provision our images, but it’s worth noting that there are the chef-maintaned bento boxes you can look at for full examples.
To build our Ubuntu 20.04 image, we start from scratch using the ISO. While it is possible to start from another image, we prefer this method because it gives us total control over what goes in the image.
You can see a full example of the Packer file we use here. The most interesting part of this step is configuring the boot_command
. This is a command that is typed at the install prompt when the ISO boots. Ours looks like this:
"boot_command": [
" <wait><enter><wait>",
"<f6><esc>",
"<bs><bs><bs><bs><bs><bs><bs><bs><bs><bs>",
"<bs><bs><bs>",
"/casper/vmlinuz ",
"initrd=/casper/initrd ",
"autoinstall ",
"ds=nocloud-net;s=http://{{.HTTPIP}}:{{.HTTPPort}}/ubuntu-20.04/ ",
"<enter>"
],
There are a few interesting points to notice here. The first two lines get us from the splash screen to the custom boot command entry on the installer. Then, the large number of <bs>
are shortcode for backspace
– we’re deleting all the prefilled boot commands so we can type our own.
Note that even though each of these entries is a new item in the array in our config file, they all get entered as a single line. It’s just broken up like this to make it easier to read.
We’re using the new AutoInstall method for Ubuntu 20.04. Previous versions use debian-installer preseeding, but that method didn’t immediately work with the new ISO.
Packer will start a small HTTP server when the build is run and substitute the {{.HTTPIP}}
and {{.HTTPPort}}
variables with the corresponding IP and Port. You must also set the http_directory
configuration option to specify which directory on your filesystem hosts the files you want the HTTP server to serve. We have a directory called ubuntu-20.04
within that directory, and that in turn contains a user-data
file which contains our AutoInstall config. I also found that AutoInstall expects a file called meta-data
to be present, although it doesn’t require any content so I simply have an empty file called meta-data
alongside user-data
.
Our user-data
file looks like this
#cloud-config
autoinstall:
version: 1
apt:
geoip: true
preserve_sources_list: false
primary:
- arches: [amd64, i386]
uri: http://gb.archive.ubuntu.com/ubuntu
- arches: [default]
uri: http://ports.ubuntu.com/ubuntu-ports
identity:
hostname: ubuntu2004
username: vagrant
password: <encrypted password>
ssh:
allow-pw: true
install-server: true
locale: en_US
keyboard:
layout: gb
storage:
layout:
name: direct
config:
- type: disk
id: disk0
match:
size: largest
- type: partition
id: boot-partition
device: disk0
size: 500M
- type: partition
id: root-partition
device: disk0
size: -1
late-commands:
- "echo 'Defaults:vagrant !requiretty' > /target/etc/sudoers.d/vagrant"
- "echo 'vagrant ALL=(ALL) NOPASSWD: ALL' >> /target/etc/sudoers.d/vagrant"
- "chmod 440 /target/etc/sudoers.d/vagrant"
Note that the vagrant bits are somewhat unique to us. We create a user called vagrant
as part of the install. That’s so we can use this image as a vagrant box later on. Note also at the end that we add vagrant
to the sudo config and ensure that it doesn’t require a password to run sudo commands. This ensures that when the image is used in vagrant, it doesn’t prompt for a password before running a command with root privileges.
Then we come to the provisioners. For this base image, we run two scripts, one to update all the packages, and the other cleans up a few things:
sudo apt-get update
sudo apt upgrade -y
sudo apt install apt-transport-https -y
and
sudo apt-get clean
FILE=/etc/cloud/cloud.cfg.d/50-curtin-networking.cfg
if test -f "$FILE"; then
sudo rm $FILE
fi
FILE=/etc/cloud/cloud.cfg.d/curtin-preserve-sources.cfg
if test -f "$FILE"; then
sudo rm $FILE
fi
FILE=/etc/cloud/cloud.cfg.d/subiquity-disable-cloudinit-networking.cfg
if test -f "$FILE"; then
sudo rm $FILE
fi
The interesting thing in the second script is the removal of the *.cfg
files from /etc/cloud/cloud.cfg.d/
. Those files get created by AutoInstall and include config that prevents cloud-init from correctly running a second time. Probably not a problem in most cases, but our VMDK images are destined for Openstack which uses cloud-init to configure the instances on boot.
Finally, we repeat this style of config many times for different versions of Ubuntu and CentOS, but also Windows desktop and Windows Server editions. In most cases, we build a base image from an ISO, as above, and then build more specialised images using those base images as starting points. Some of our more complicated configurations also use Puppet as a provisioner to install things such as SQL Server, Oracle or Visual Studio to allow our development teams to easily test against those platforms.
]]>One small thing I saw several references to, though, was the Folding@Home project. It’s something I had contributed to before, but had largely forgotten was a thing. It’s main purpose is to simulate protein folding with the goal of using that information to allow medical researchers to develop vaccines and other treatments for various illnesses.
Unsurprisingly, they started providing work units for Covid-19 research and calling on people to donate computing power.
That gave me an idea. At Redgate we have a lot of spare computing capacity in our hypervisor clusters, so I figured it was worth spinning up a few VMs to run the folding client. While this isn’t going to make a huge impact right away, hopefully it’ll go someway to helping the longer term cause of finding a vaccine.
As many of our systems as possible are built and configured using Puppet, so I took the opportunity to write a puppet module to install and configure the client.
The puppet module is fairly simple. It only works on Debian based systems for the moment though.
As of today, Redgate now has 5x 8Core VMs running, each with 2x 4CPU work slots on them. We’re also considering installing the client on our TeamCity agents to utilise the spare compute capacity there, although we obviously need to be careful not to disrupt our production workloads ;)
If you want to see how we’re getting on, you can checkout our team stats page here.
]]>This worked pretty well, but there were still a few flaws that I mentioned in my post at the time.
This week, I had a bit of time to tackle this problems and see if I could improve the system. Turns out I could.
I stumbled across a python project called Celery which promised to deal with the task queue element of the system. One of the problems I had was that if an ffmpeg process died while encoding, then the message would still get ack’d even though the process failed. Celery solves that by only ack’ing the message once the process completes successfully.
Another nice feature I noticed was that you can query the state of workers. Running celery inspect active
in the working directory of the application on any of the worker nodes gives a list of the workers currently up and the message they’re processing.
I made a couple other changes too. Instead of this being a docker application, I moved it to a simple python app that runs in a VM. Docker didn’t make sense for this, and it was far simpler to just have an Ubuntu Server VM configured by puppet.
Puppet ensures all dependencies are installed, checks out the code and ensures the worker process is running using Supervsiord
. Supervisor can then be used to stop the worker process if needed, and the nice thing about Celery is that if you do that before an encode completes, the message gets requeued and another worker will deal with it instead.
The whole project is in Github here. There are two main components:
queueFiles.py
deals with getting the messages onto the queue. It doesn’t really matter how this is done, only that it is.videoTasks.py
contains the encode
function that actually does the processing. Here you’ll find the ffmpeg
command that gets executed. It’s pretty basic, but I find it covers most scenarios with good quality output.It works really well, but one of the things I found quite lacking was it’s ability to create dashboards. Sure, you have maps but there’s only so much you can do there, and they just don’t look all that good. Then I found this blog post on the PRTG blog about someone having written a PRTG data source provider for Grafana. Grafana is excellent a creating dashboards and drawing graphs, and what’s more, the end result looks good.
I set about giving it a try, and the results are pretty good so far.
I did find the installation documentation a bit lacking to start with, so here are my findings…
The install guide is on Github here along with the Grafana plugin.
The first stumbling block for me, was that you have to use the passhash and not password for your API user. To be fair, it does say that in the configuration wizard, I just couldn’t read. You can get the passhash from the My Account
section once you’re logged into PRTG.
Graph
most likely.Metrics
section select PRTG as your datasource
and then each of the Group
, Host
, Sensor
and Channel
fields will autopopulate with what’s in your PRTG installation.Remember to save your dashboard after each change. This doesn’t happened automatically, and if you refresh the page you’ll loose your changes.
If you add new things to PRTG, then you might need to refresh the Grafana page completely before those things show up in Grafana.
Table
panel type in Grafana. However, you should use raw
query mode and reference the PRTG api directly.
table.json
, Query String: content=sensors&columns=device,sensor,status,message,downtimesince&filter_status=4&filter_status=5&filter_status=10
. This will return all messages for Warning, Error and Unusual states. The filtering is done based on the filter_status
options, the documentation for which I found hereColumn Styles
to color code the rows, I found I had to delete all existing rules, and create new ones before it would behave correctly.Finally, here are a couple screenshots of dashboards I created.
]]>I was spurred in to action after spotting a couple posts on Intructables of people doing similar things here and here. I’d also seen countless examples of people creating smart mirrors using similar techniques.
I starting investigating a bit further about how I could embed a google calendar into a web page, when I came across Dakboard which has a bunch of integrations and gives you a nice dashboard at the end of it.
First things first, I set up Dakboard how I wanted it. I intergrated it with my Google Calendar, my Google Photos library, our shared todo list on Wunderlist, and got it to pull in weather from Yahoo.
Configuring the Raspberry Pi was realtively simple as well.
First off, we need to rotate the display.
Set display_rotate = 1
in /boot/config.txt
. I also had to disable overscan by setting disable_overscan = 1
as well.
Next, install chromium by running apt-get install chromium-browser
and finally update the autostart file to launch chromium on boot into kiosk mode.
Edit /home/pi/.config/lxsession/LXDE-pi/autostart
to include
@chromium-browser --noerrdialogs --incognito --kiosk <url>
and replace <url>
with your Dakboard URL.
Note that the location of that file seems to change between versions of raspbian, this is where it was on the latest version as of August 2017.
You may also want to install unclutter which will hide the mouse pointer for you by running apt-get install unclutter
. You’ll then need to add the following to the autostart
file:
@unclutter -display :0 -noevents -grab
If you haven’t already, you may also need to set Raspbian to auto login which you can do in the raspi-config program.
One last thing I added was automatically switching the display off. I didn’t want it lighting up my hall all night, so I created two cron jobs to switch the display on and off.
To turn the display off, run /usr/sbin/tvservice -o
and back on again /usr/sbin/tvservice -p
. This puts the display into standby and should work on most displays connected via HDMI. DVI and VGA connections may not work as well (or even at all).
I put those commands into the crontab file for the root user, and had the screen turn on at 8am and off at 10pm.
* 8 * * * /usr/bin/tvservice -p
* 22 * * * /usr/bin/tvservice -o
To test that it all works, reboot your system and it should start up, auto login, and display your webpage.
There are two main parts to the hardware – the display and the frame.
For the display, I had some spare Raspberry Pi’s and an old monitor lying around. I put together a quick proof of concept, and quickly found that although it worked and the dashboard looked great, the old Pi 1’s were not powerful enough to render the webpage in a timely fashion. So I ordered a brand new Raspberry Pi 3, which is much better.
Next I ripped apart the display to extract it from the ugly plastic casing to see what I had to work with to make the frame.
One of the problems I immeidately found was that when you take into account the power supply and control board, this was already quite thick at around 6cm. But….I also needed to get power to the Raspberry Pi and the display. My initial thought was to include a 4-way power strip behind the display, however that quickly increased the depth to about 10cm, which I didn’t like.
I spotted in one of the posts above that they had taken 5v from the monitor power supply board - I figured there must be a 5v rail on mine somewhere so some more dismantling was required. I was preparing myself for spending a good chunk of time trying to identify a 5v rail, but when i got the plastic casing off I was greeted with this:
…I was very happy.
The soldering iron came out, an old micro USB cable was sacrifced, and not long after I had a Raspberry Pi powered from the monitors power supply.
Next up, was the frame. This was probably the most complicated part of the project. After reading the two posts I had a pretty good idea how I’d do it. I had to make a few adjustments to the methods in those posts though to account for my lack of tools. Specicially no access to a router or table saw, meant I wouldn’t be cutting any grooves and sliding the display in. Mine would also be thicker than in those examples on account of the power supply and control board on the back of the monitor. I chose to keep the original metal casings for those for simplicity, but it did mean my screen was about 6cm deep.
I chose to make the frame in a similar way to the second post above – that is, a deep section that sat around the display, and then a front section that covered the edges up a bit. Those two would be glued together and the display would fit in from the back.
Originally I was going to have nice mitre cuts for the corners, however it turns out I also lack the nescessary tools and/or skill to make accurate 45 degree cuts, so I changed my mind and instead had the edge peices butt up against each other at 90 degrees. It doens’t look as nice, but better than having gaps I think.
On the back section, I added a few cross peices to hold the power supply in place. The back section and the cross peices were screwed together, and the front piece was glued on. The cross peices would come out later in order to install the display.
Several hours later the glue had dried enough to assemble it all and see what it looked like.
On one of the cross braces I screwed a couple of stand-offs in, and then mounted the Raspberry Pi on those. It just fitted…more by luck than judgement I think.
Now, the moment of truth. Would it work. I powered it up and waited patiently for it to boot.
It worked!
All that’s left now, is to paint it and attach it to the wall.
I’ve painted the frame, and hung it on the wall now. Here are a few more photos of it in action. You may also spot my method of hanging it – some wire between two loops on the inside of either edge. That then hooks on to two giant picture hooks on the wall.
]]>Fortunately, I had an old PC in the loft that had a Hauppage WinTV card that took a composite video input. Unfortunately, the WinTV application was the only way I could record the video in Windows, and that only worked on Windows 7. I dug out an old Windows 7 installer and got to work. Shortly thereafter I had a working WinTV install, which is where I discovered my next problem. The only SCART -> Composite adapters I had were all video in, rather than video out and I couldn’t find my switchable one. Thankfully the internet has pin outs for SCART connectors, and with the appropiate application of a soldering iron I soon had a frankendapter that would do both video in and out.
After about half a day of faffing around I had a system that could capture video. The only downside was that a 2 hour video produced a 5GB mpg file. That file needed transcoding to something more sensible like x264 in an mp4 container. This is where I got a bit carried away.
Instead of doing what any sane person would and just using Handbrake, I thought it’d be much better to create myself a little encoding server. Except it was more like an encoding farm…or at least has the capability of being such a thing.
At a high level, it consists of:
The basic process flow is this:
This is far more complicated than I required, but it was fun to do. There’s a few nice features about this:
However, there is also a few problems:
If I took this much further I think I’d end up with a very small scale version of Amazons Elastic Transcoder, which on the face of it appears to work in a similar way…. perhaps that’s where I got the idea from.
So…how has the plan gone? Well….I’ve got one box full of VHS tapes that have been digitised, and about another 10 tapes to go, which is pretty good I think. The process actually works quite well, except for the part where I have to cue up and start/stop the recording of the tapes manually….unfortunately I don’t think there’s really a way around that.
]]>Now, using a Raspberry PI as a DIY NAS is nothing new. You only need to google for ‘Raspberry Pi NAS’ to see what I mean. I wanted something a bit different. I wanted something scalable and redundant. I’d heard about Gluster before and knew roughly what it could do, but never really played with it. This is a perfect opportunity then. Sure there are several posts around the internet of people doing the exact same thing, but I wanted to give it a go anyway.
This post is going to be a brief guide on what I set up and how you can replicate it. I’m not going to go into huge detail on any of the technologies I used, there’s plenty of resources that already do that.
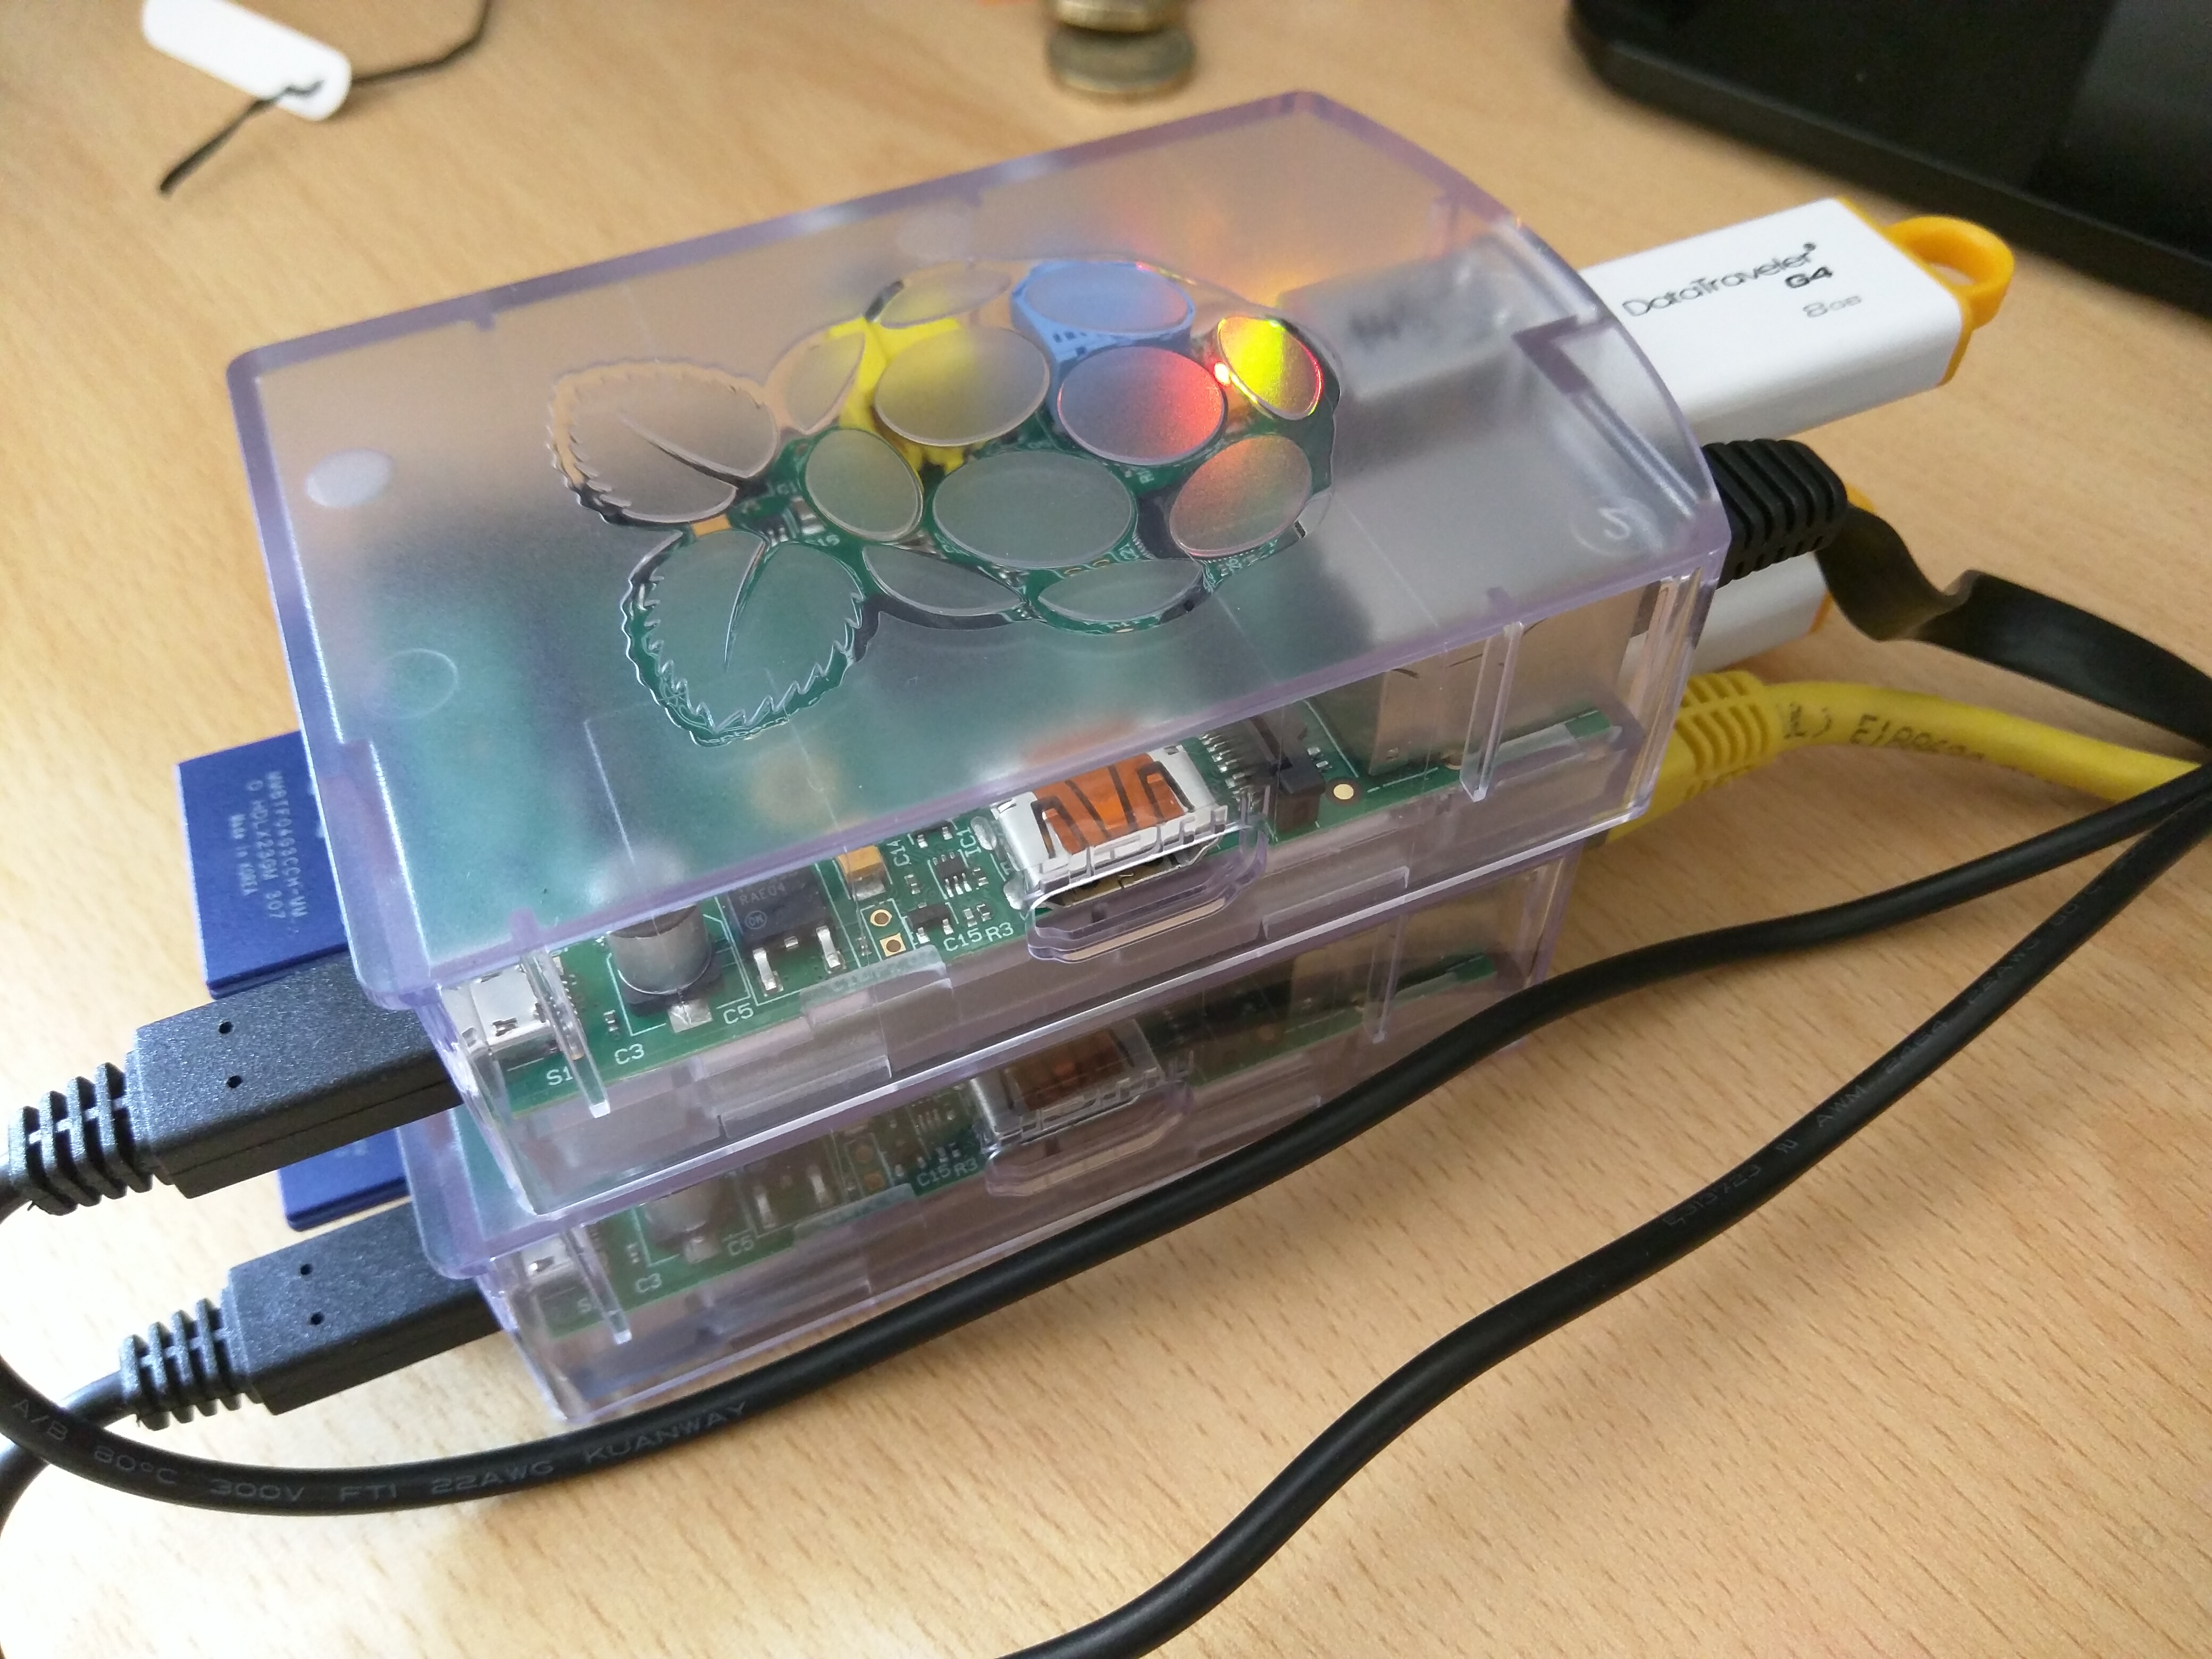
This is what I ended up with:
To start with you’ll need two Raspberry Pi’s. By the way, this will work on any Debian based operating system. I’m using Raspbian Wheezy on a Raspberry Pi 1, but it’ll work just as well on Ubuntu on an x86 system. Also, I know Wheezy is quite old now, but it’s the only one that’ll easily fit on the 4GB SD cards I had to hand.
On each node you need to create a file system for Gluster to use. I used XFS on the USB sticks.
Install xfsprogs:
apt-get install xfsprogs
My USB disks appears as /dev/sda
, so to format them to XFS:
mkfs.xfs -i size=512 /dev/sda1
Make a directory to mount this on:
mkdir -p /data/brick1
And finally, make sure this gets mounted at boot by adding the following to /etc/fstab
:
/dev/sda1 /data/brick1 xfs defaults 1 2
Finally, mount it:
mount -a
Now, you may find you get an error at this point. I did, but I think that’s because I had updated the kernel just before and hadn’t rebooted. If it fails with an error like unknown filesystem xfs
, then reboot the node and try again.
You can check if the volume is mounted by looking at the output of mount
:
/dev/root on / type ext4 (rw,noatime,data=ordered)
devtmpfs on /dev type devtmpfs (rw,relatime,size=218416k,nr_inodes=54604,mode=755)
tmpfs on /run type tmpfs (rw,nosuid,noexec,relatime,size=44540k,mode=755)
tmpfs on /run/lock type tmpfs (rw,nosuid,nodev,noexec,relatime,size=5120k)
proc on /proc type proc (rw,nosuid,nodev,noexec,relatime)
sysfs on /sys type sysfs (rw,nosuid,nodev,noexec,relatime)
tmpfs on /run/shm type tmpfs (rw,nosuid,nodev,noexec,relatime,size=89060k)
devpts on /dev/pts type devpts (rw,nosuid,noexec,relatime,gid=5,mode=620,ptmxmode=000)
/dev/mmcblk0p1 on /boot type vfat (rw,relatime,fmask=0022,dmask=0022,codepage=437,iocharset=ascii,shortname=mixed,errors=remount-ro)
/dev/sda1 on /data/brick1 type xfs (rw,relatime,attr2,inode64,noquota)
As you can see, at the bottom there’s a line with /dev/sda1 on /data/brick1 type xfs
.
Now that the nodes are ready, we can install gluster
apt-get install glusterfs-server
That’ll take a bit of time, but the service should start automatically. Then you need to probe each node from the other one to register them in Gluster.
From node1:
gluster peer probe node2
From node2:
gluster peer probe node1
In each case you should see something like this:
root@node1:/home/pi# gluster peer probe node2
Probe successful
Next, we need to make the Gluster volume.
On each node:
mkdir /data/brick1/gv0
and then on one of the nodes:
gluster volume create gv0 replica 2 node1:/data/brick1/gv0 node2:/data/brick1/gv0
followed by:
gluster volume start gv0
You should see success messages which means it’s time to test your new Gluster volume.
On one of the nodes, make a directory and mount the gluster volume onto it:
mkdir -p /mnt/gv0
mount -t glusterfs node1:/gv0
The should succeed without errors, then you can create a file in /mnt/gv0
:
touch /mnt/gv0/testfile
and it should appear on both nodes in /data/brick1/gv0
:
root@node1:~# ls /data/brick1/gv0/
testfile
root@node2:~# ls /data/brick1/gv0/
testfile
That’s Gluster done.
Next up, we can install Samba on our nodes to present a Windows file share.
I’m choosing to put Samba on the Gluster Nodes and share the mounted volume /mnt/gv0
. There are plenty of other ways to do this, and I suspect a ‘best practice’ would probably be to have one or two additional machines to present the file shares and the leave the Gluster nodes to just do Gluster. But, I only have two PIs spare at the moment…
First things first, we need to mount the Gluster volume on both nodes. First, make a directory for it on both nodes:
mkdir -p /mnt/gv0
Then add the following to /etc/fstab
on node1:
node1:/gv0 /mnt/gv0 glusterfs defaults 0 0
and add this to /etc/fstab
on node2:
node2:/gv0 /mnt/gv0 glusterfs defaults 0 0
Now, on both nodes install samba:
apt-get install samba
and edit the config file at /etc/samba/smb.conf
.
In the global section you’ll want:
security = user
guest account = nobody
and then a share section that looks like this:
[gluster]
guest ok = yes
path = /mnt/gv0
read only = no
Next, make sure that /mnt/gv0
is writeable by Samba on both nodes. I opted for the lazy approach:
chmod 777 /mnt/gv0
and finally, restart the Samba service to make the config active:
/etc/init.d/samba restart
You can of course adjust all those settings to own desires. That will give you an anonymous writeable share. You may want more security than that.
Time for a quick bit of testing.
With Samba installed and configured you should be able to browse to \\node1\
and \\node2\
from a Windows machine on your network and see a folder share called gluster
. You should also be able to write to that share in both instances.
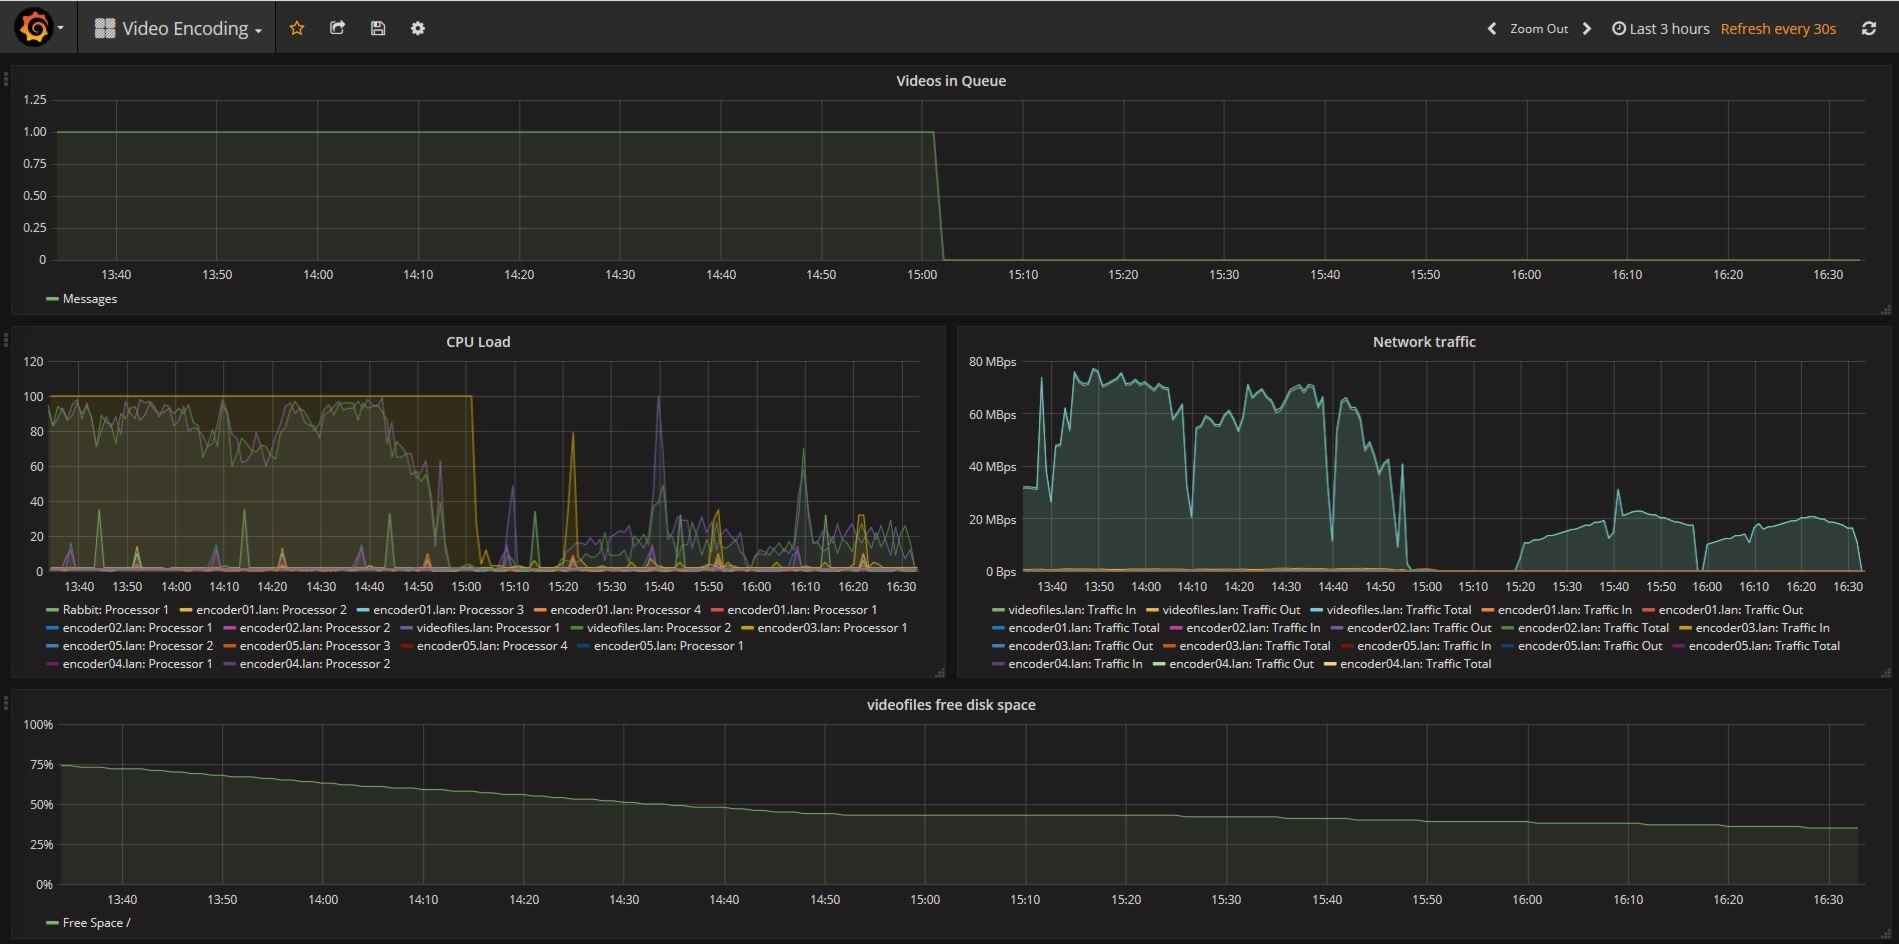
I did a quick bit of performance testing and found that a 100Mb file copied at about 20mbit/sec. That is not quick by any stretch of the imagination, but as you can see from the screenshot below, my poor Raspberry PI’s CPU was working flat-out.
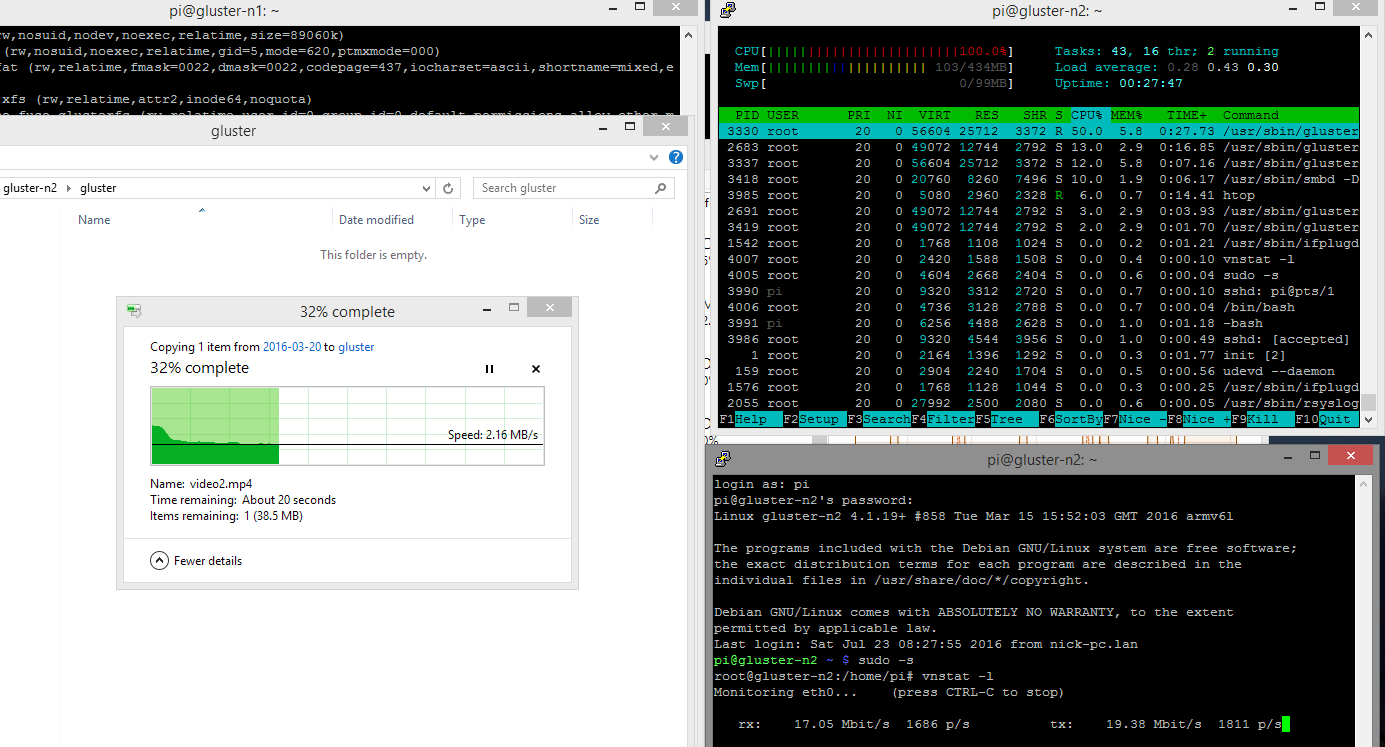
I did another test where I accessed a folder directly in Samba instead of using Gluster and saw an improvement up to 65mbit/sec. Again, that maxed out the CPU, but at least Samba could use it all instead of sharing with Gluster.
It would be interesting to see what the performance would be like using a Raspberry Pi 3… I have some spare ones at work at the moment…perhaps I’ll borrow them and update this post with the results…
Finally, our little project isn’t complete without some automatic failover.
At the moment, to access the samba share we have to point to one of the Gluster nodes directly. If that node went offline, then we’d have to manually switch to using the other one. Lets fix that. Enter, VRRP. Or more specifically in this case, keepalived.
VRRP is a protocol that allows two or more devices to share a single IP. It’s only active on one node at a time, but if that should fail another immediately brings that IP up. Keepalived is an application that implements this protocol.
Install it on both nodes:
apt-get install keepalived
I’m going to use 192.168.1.80
as my Virtual IP, but you should use any IP in your subnet that isn’t used part of your DHCP range.
Next, create the /etc/keepalived/keepalived.conf
config file and one the primary node enter this:
vrrp_instance VI_1 {
state MASTER
interface eth0
virtual_router_id 51
priority 150
advert_int 1
authentication {
auth_type PASS
auth_pass somerandompassword
}
virtual_ipaddress {
192.168.1.80
}
}
Then, on the second node, enter this:
vrrp_instance VI_1 {
state MASTER
interface eth0
virtual_router_id 51
priority 100
advert_int 1
authentication {
auth_type PASS
auth_pass somerandompassword
}
virtual_ipaddress {
192.168.1.80
}
}
Both files are very similar.
priority
should be lower on the slave nodevirtual_router_id
can be anything, but must be the same one both nodesauth_pass
should be some secure password and be identical on both nodesinterface
should refer to your network inferface, eth0 in my case.Next, start keepalived:
/etc/init.d/keepalived start
and then give it a try by browsing to \\192.168.1.80\
(or whatever IP you used) from a Windows machine. You should see your gluster share and your files. At this point you’ll probably want to assign a DNS address to that IP if you have the capability to do so.
This seems like an excellent way to get yourself a DIY NAS which features both redundancy and effectively unlimited scaling capacity. Gluster can do more than just replication – you can stripe files across nodes which means you could have 4 nodes, with a replica count of 2 to ensure redundancy. Need a bit more space? Just add another node, or another USB hard drive to an existing one and create a new brick. I also notice that Gluster can do geo-replication. I haven’t looked into it, but that could present an opportunity to make an asynchronous offsite copy of your data.
On a Raspberry Pi 1 it’s not very fast, but if you don’t care about access time then it’s a perfect use for them. Pi 3’s will probably be much faster, and at about £30 they’re pretty cheap too. You might not get all the value add features that a company like Western Digital will give you, but if you don’t care about that, then for the same amount of money you’ll get a much better NAS.
I used a few different sources when researching this:
I don’t mean that in the sense that is it untidy, or that there are cables trailing all around the house. Instead, just the sheer number of devices I have connected and doing things.
So, I decided to write it down to see exactly how out of hand it really was. Plus…I’m a sysadmin and documenting your stuff is good practice, right?
Here we go then. This is what I have in my network:
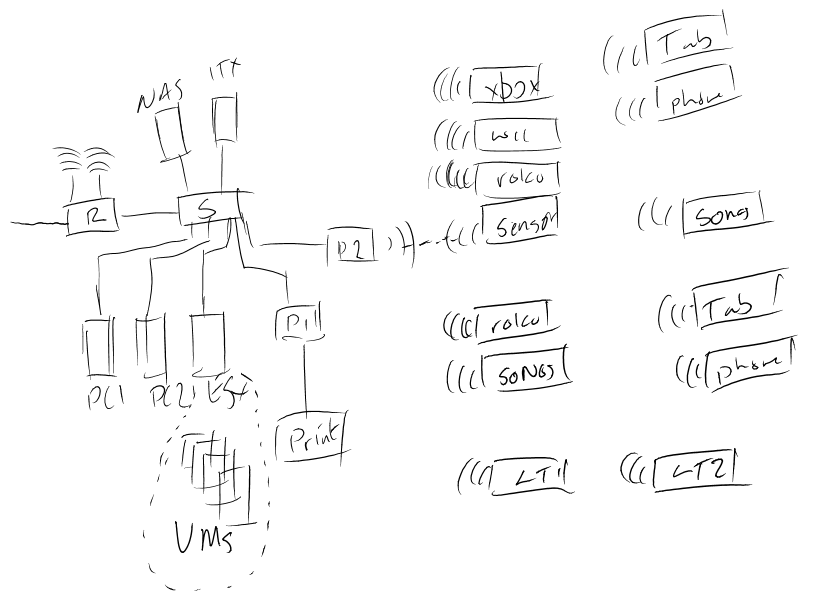
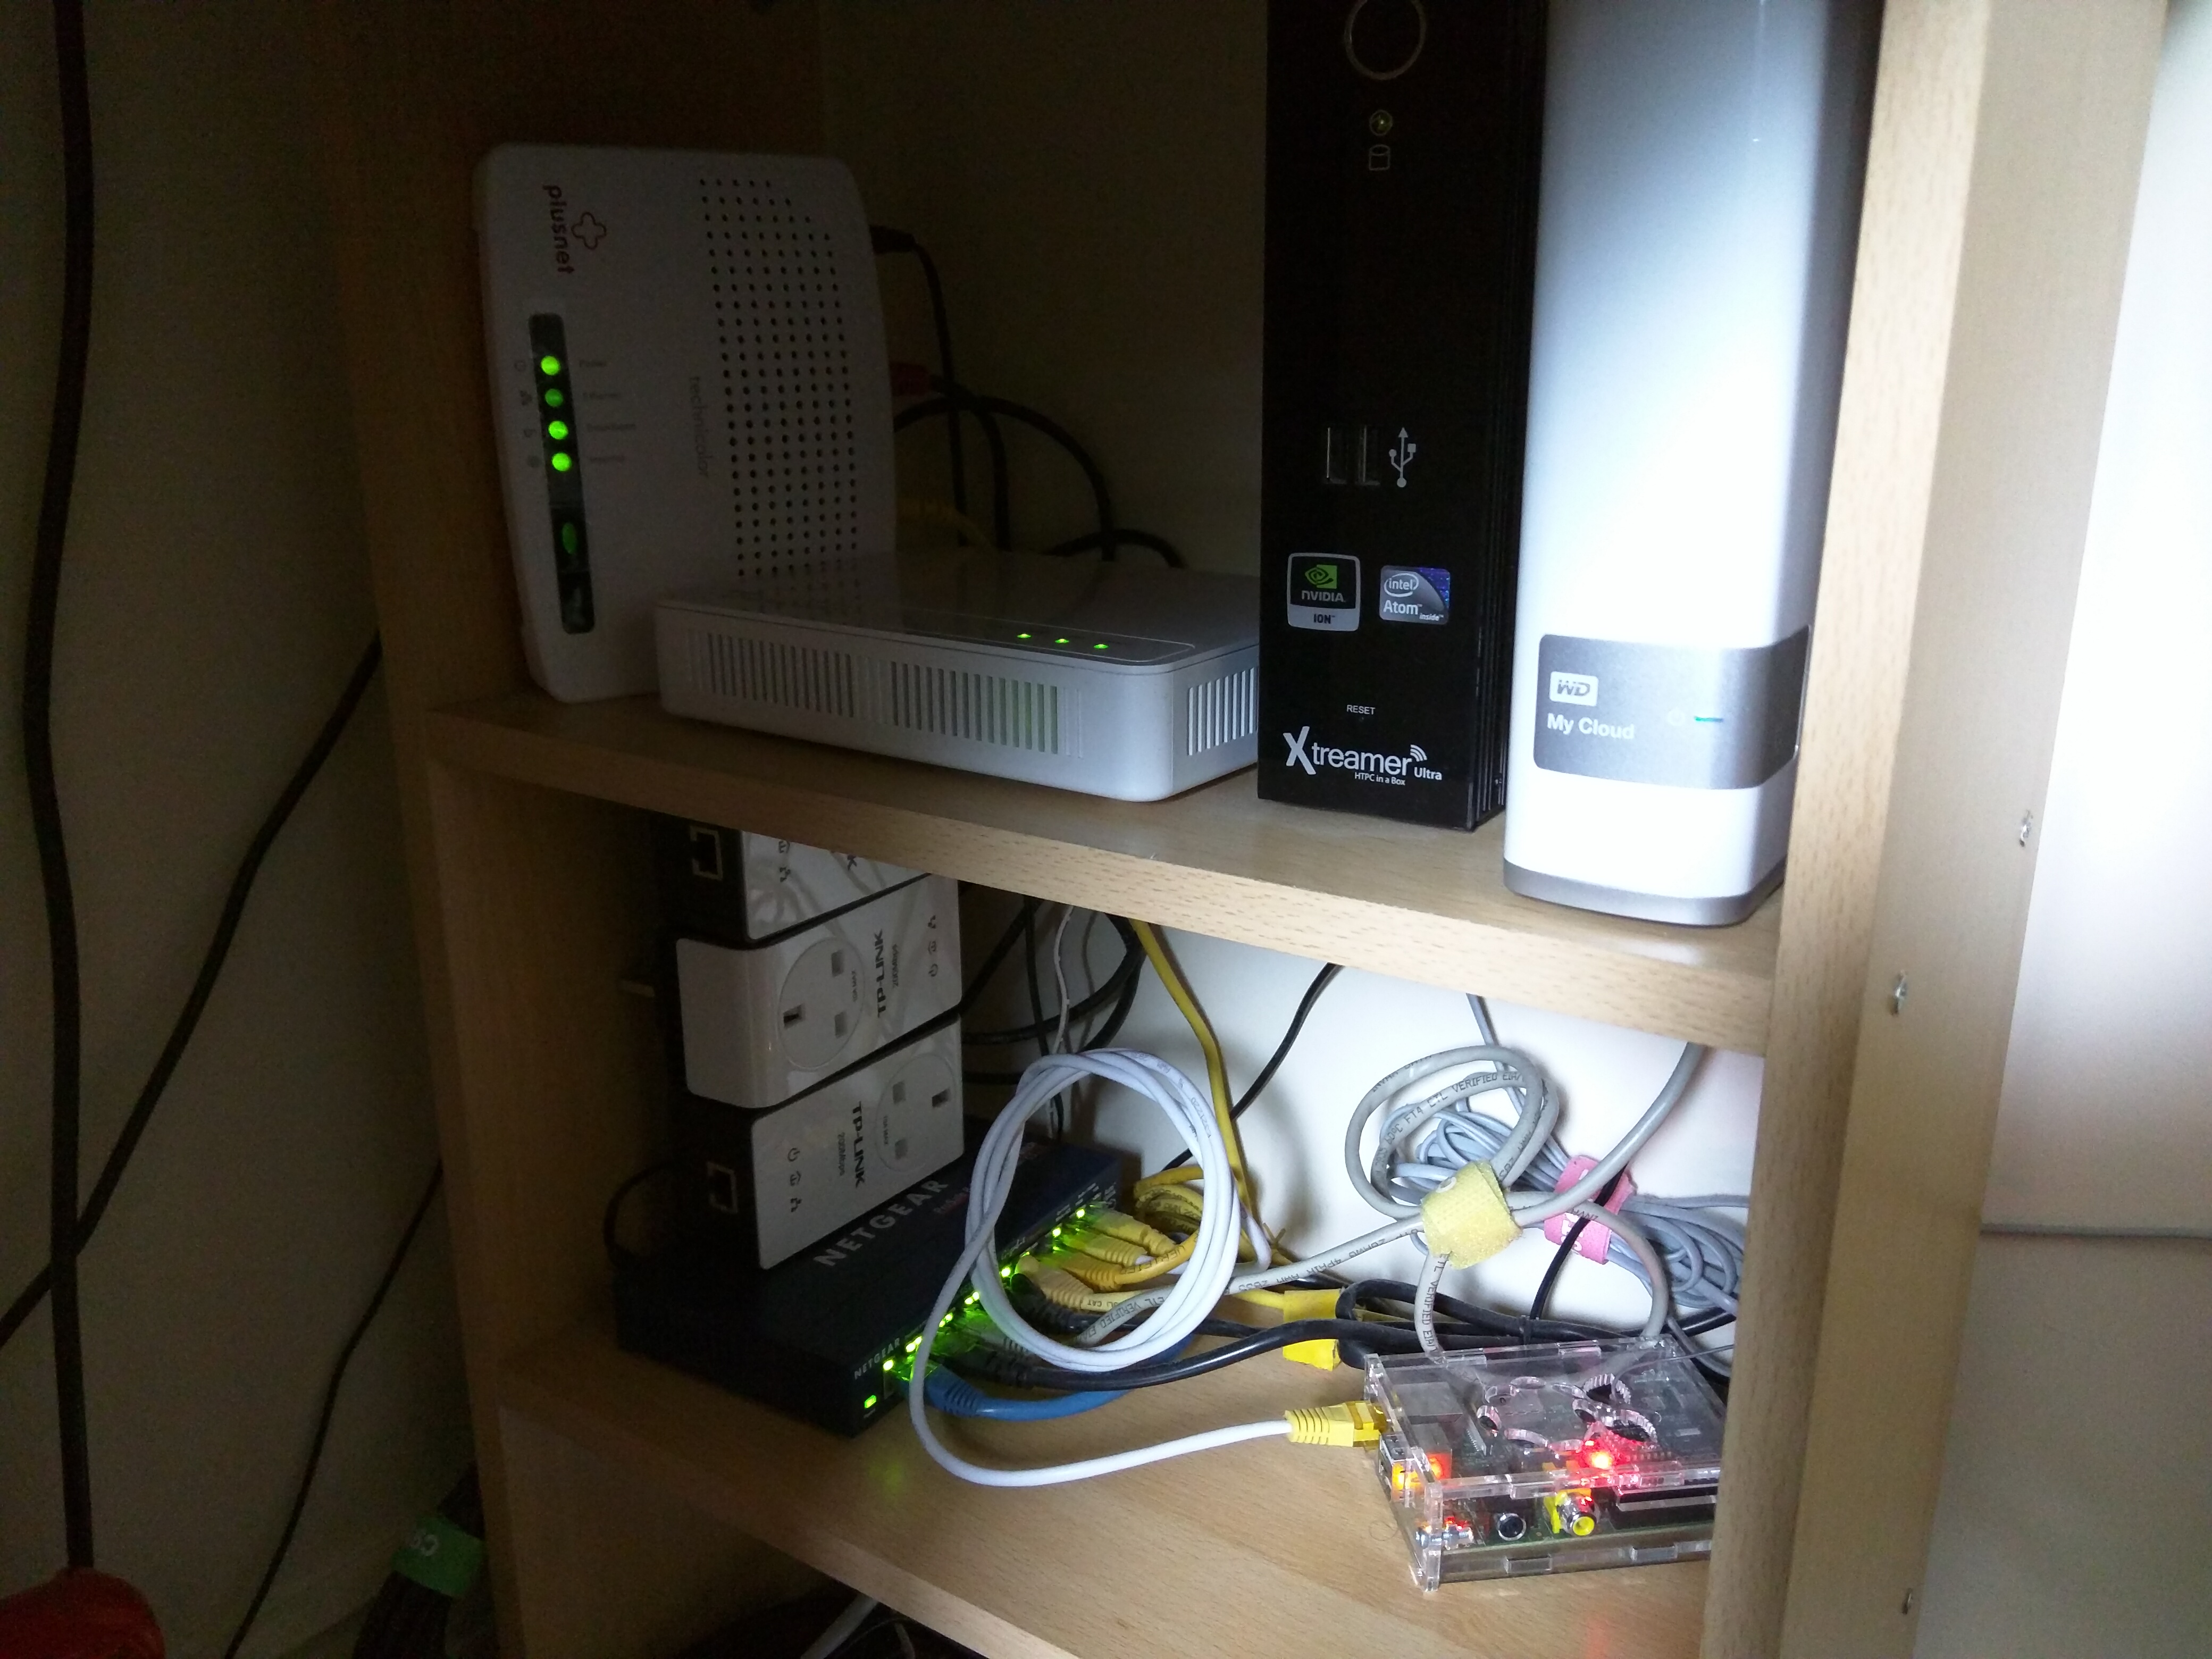
The router is a standard unit supplied by my ISP. It gives me WiFi and NAT. A single connection is made from that to the switch which handles all other switching. DNS and DHCP are handled by the Mini ITX PC which runs dhcpd and BIND on Ubuntu.
The NAS is a Western Digital My Cloud which, to be honest, is a bit crap. I’ve had to enable SSH and disable most of the “value add” features they put on just to get a vaguely usable SMB share.
The Raspberry Pis each perform a different role; 1 acts as a Print Server, 1 has an XRF module from the wireless inventors kit and acts as a sensor gateway for a light and temperature sensor in my living room. The third Pi sits up in the attic with my model railway where it controls a point motor via some relays. Eventually when I get back to it I’ll add more point motors and relays and control the entire layout.
Next, the VMs. There’s a few of these. One of them runs EmonCMS which stores and present the sensor data collected by the Pi above. There’s also a Plex Media Server and a puppet master. Finally, there’s a VM for running docker containers. Those are for a little project I have on the go for digitising VHS tapes. The tapes get recorded using a TV Capture card in one of the PCs to mpg. That file is stored temporarily by another VM and added to a RabbitMQ queue. Container instances then take a file from the queue and begin transcoding it to mp4 for long term storage.
The remaining items are fairly straight forward; An Xbox One, Wii and Roku 2 make up the TV unit in the living room. While a Roku Streaming stick and one of the SONOS Play:1’s live in the bedroom. The other SONOS is in the kitchen.
If you’ll excuse the terrible diagram and handwriting, this is what it looks like if you draw it out.
All in all, that’s not a small number of devices for two people… and yet, I would happily add more. In most cases I don’t add these things because I need to. I do it because I enjoy it. I’m a sysadmin by day and I enjoy tinkering in my spare time. Yes, my home network is a little out of hand….but y’know what? On balance, I think I like it that way.
]]>So, what actually happens? I have two Hyper-V clusters, each running on Windows Server 2012 R2. One is a 5 node cluster, the other only has 2 nodes. Every now and then (usually once or twice a week) a VM will suddenly drop off the network. We’ll take a look to find the VM up and running but showing that the network has no Internet access – the little yellow triangle of doom.
Further investigation at this point reveals that:
I have been speaking to Microsoft to try to resolve this issue with no luck so far. We did attempt to start a netsh trace
on both VM and host, which was unsuccessful. The netsh
command just hangs in the VM and never completes.
This happens to VMs on both clusters and is not confined to a single host. My initial speculation was that it was an issue with the virtual switch and installing a recent batch of Windows Updates was to blame. However, rolling those back had no effect.
Microsoft’s initial thought was that it was something on the VM that was at fault. I wasn’t sure that could be the case given it happened on multiple VMs, seemingly at random, but some more recent developments (such as the issue running netsh
) are making me reconsider.
Right now Microsoft think it could be a filter driver in the VM, in particular the one from our ESET AntiVirus software. It’s certainly plausible, so we have removed it for now and we’ll see what happens over the next week.
I’ll post updates here with how we get on…
2016-07-23 Update: It’s been a little over a week now, and since removing ESET AV from the server we have had no more network failures on that particular VM. I’m keeping an eye on it, but I suspect this will prove to be the culprit.
]]>